When I am asked to design a user interface for a website, I immediately ask the question - should I also design an interface for mobile devices and, as a rule, I get an affirmative answer. The fact is that modern websites and programs that can be called digital products are, as a rule, part of a large service. And the further, the more digital products (websites, applications) will be involved in the interaction with the user.
Let me give you an example of a rather popular service - listening to music. I listen to music on a personal computer running OS X, on a smartphone (iOS), and on an Apple TV. Apple has thought through the process of consuming music quite well: I can buy an album on my iPhone, and then I can listen to this album on Apple TV, to which I have large speakers connected. However, I cannot start listening to a certain song on my iPhone, and then continue listening to it on Apple TV - for this I have to search for the desired album in the Apple TV menu, this procedure cannot be called simple. That is, at Apple, no one bothered with such an opportunity and did not implement it. That being said, both the iPhone designer and the Apple TV did a good job. The functionality that I need is on the border of two devices and it is not clear who should be responsible for designing such bundles.
This example shows that in our time it is not enough to think through the details of the user interface of one digital product in isolation from interaction with other products with which they are in a single infrastructure. You need a tool that allows you to identify problems at the seams, and also allows you to design connections between products. As usual, the need provoked the creation of a wonderful new technique called “Customer Journey map».
Customer Journey Map is, perhaps, best tool User Experience, over the past 10 years (after characters).
What is a service?
What is a service? For lovers of strict definitions, I will quote from GOST-9000-2008:
A service is the result of at least one action that is necessarily carried out in the interaction of a supplier and a consumer, and, as a rule, is intangible.
Let's remember the word "result" - this is what is most important to any consumer.
As I reported, today's consumers interact with mobile devices, web browsers, people, environments and spaces, and so on. Each act of consumer interaction with a service is called a “point of contact”.
Contact points can be not only digital, but also analog or offline.
Take a modern bank, for example. What points of contact can we highlight here?
- bank website;
- web service "client-bank", where the user can carry out transactions with his account and bank cards;
- mobile application "client-bank";
- a physical branch of a bank that can also be considered a product. Just like with websites, there is a navigation system inside the bank branch.
Suppose you came to the bank for some purpose and are not yet very familiar with the rules of its operation. If the navigation was poorly designed, then you may not understand exactly who to contact to solve your problem. You have to contact the girl at the reception, to whom there may be a separate line of customers.
With this example, I wanted to illustrate the simple idea that bank branches can and should be designed similarly to websites.
What is Customer Journey Map?
So what is a Customer Journey Map (for short, just CJM)?
CJM is a directed graph, on which the path of the consumer of the provided service is displayed with the help of points of contact. The CJM records the details of the interaction with the service.
That is, CJM displays exactly how the consumer interacts with the service - which points of interaction exist, through which channels the interaction is carried out (web, mobile application, offline point of presence, etc.), as well as what happens inside each point of contact.
Here are examples of typical CJMs (just pay attention to the outside of the diagram for now):
customerexperienceplanning.com thebridge.nl
Let's take a look at a simplified CJM example:
 Mel Edwards, 2011
You see three representatives, each representing a different consumer group. In the process of consuming a service (achieving a goal), they have to interact with different products. At each point, an act of service takes place with a certain level of quality:
 Mel Edwards, 2011 & Alexey Kopylov, 2013
The overall experience of a service usually depends on the quality of service at all points of contact. The principle of the weakest link is at work - one unsuccessful interaction casts a shadow on the entire service. Therefore, it is very important that each touchpoint is worked out with maximum quality.
However, it so happens that all the points of interaction are implemented just fine, and the problems are hidden at the boundaries of the transition from one point to another. That is, it may turn out that all employees of the company serve customers well, but some consumers still do not reach their goal:
 Mel Edwards, 2011 & Alexey Kopylov, 2013
Let's illustrate this with a simple example: many online stores require you to go through the registration procedure and, often, there is such a step as confirmation of registration by a special link that comes to your mailbox (this is necessary to prove that a real person is registered, and not a robot) ... In this case, the probability increases that the user will not be able to go through this step: perhaps the letter with the link got into spam, perhaps the user made a mistake and entered gmail.ru or another non-existent address instead of gmail.com, perhaps he completely forgot that he had to confirm the registration. In the examples known to me, the loss of users at this step reached 70%!
How can we lower these barriers? For example, you can control what exactly the user enters as an email and offer to correct obviously erroneous addresses. Further, if the user has not clicked within a few days on the link from the email message, then you can re-send him an email with the link. But the best thing, of course, is to abandon this step altogether - to use other methods of protection against robots!
In general, you should always implement the system so that any point of contact motivates the consumer to go to the next step (principle "Push"), and the next point pulled the consumer from the previous point of contact (operation "Pull"). The push-and-pull approach promotes a smoother customer experience with a service.
Consider the example of listening to music. In fact, Apple has a way to go from listening on an iPhone to listening on an Apple TV, which is AirPlay. However, not all consumers are aware of magic technology and therefore cannot use it. There is a rule that the functionality that users cannot find for them, as it were, does not exist. It would be possible to implement the "push-push" principle in this way: as soon as the user is in the area where the Apple TV is available, he immediately receives a message (not interrupting listening) that he can turn on the audio system (connected to the Apple TV) and continue listening already on her. Conversely, as soon as the user turns on the TV, he sees a message about which song is playing on the iPhone and what needs to be done to redirect the sound to the audio system (by pressing one button).
So, CJM allows you to control the design process of services that are implemented using various interactive products, as well as to visually visualize the process of service execution itself.
CJM Tasks
I will list all the tasks that CJM solves:
- Creation of continuous UX throughout the entire service consumption.
Remember the aforementioned push and pull. - Increase in consumer conversion.
By reducing barriers, as well as by reducing losses during the transition from the point of contact to the point of contact, more consumers reach the goal. - Increased customer loyalty.
Retention rate - the number of returning consumers grows if we have designed and implemented a service without barriers. - Increasing the responsibility of the company's specialists.
Each point of interaction has its own responsible employees from the side of the company. After we have mapped all the touchpoints, all employees in the company can see who is responsible for what and how they are doing their job (if we set up KPIs for each touchpoint). This in itself increases the level of responsibility. - Accelerate the development of multichannel services and products and improve the quality of development.
Due to the fact that all parties involved in the development more fully see how the service is carried out, and also see all potential weak spots services and can intervene in their development in time. - Create exciting new interactions.
There is an opportunity to come up with and implement new innovative features (remember the example of continuing to listen to an audio recording when switching from one device to another).
Everything looks great, but how to create CJM?
How to create a CJM, step by step instructions
Step # 1. We identify all points of contact and channels of interaction
We draw on a map all the points of interaction of a certain typical consumer with a service. We do not forget anything! It may turn out that there are hidden touchpoints that you did not know about. For example, you might find out that some of the problems consumers solve in an informal way - using social networks (which is often the case). That is, one of the company's employees communicates with the consumer directly within the social network and helps him achieve his goal. It is necessary to record everything, including such points of interaction!
In order not to miss anything, use the mystery shopping method, that is, go through all the steps of a typical consumer of the service yourself. You can also find an outside company that will professionally identify all touchpoints with a large number of respondents.
Remember, one CJM diagram is drawn for one target group (or for one character if you are using the character technique)!
Further, it is important for each point to determine all possible channels of interaction. That is, to determine with the help of which devices interactions are carried out, for example, it can be web browsers, mobile applications, phone calls, skype calls, email, social networks. Don't forget about offline channels - visiting offices, meeting with couriers, meeting with agents, and so on. Again, unexpected channels may open up for you, for example, you may find out that a huge number of consumers come from mobile devices. And it may turn out that your site design does not take this communication channel into account.
Graphically, CJM can have a different form - diagrams can be linear if the nature of interaction with consumers is also linear:
 desonance.wordpress.com
 It can be branched if consumers have multiple alternative interaction scenarios:
 Alexey Kopylov, 2013
 May have a temporary view - suitable for displaying interaction with the service during the day:
 customerexperienceplanning.com
 We can make several CJM diagrams for different consumer groups and for different purposes.
Step # 2. Describing contact points
Now each point of contact and each channel needs to be described.
Here is some typical information we need to capture:
- Interaction channel
Points can have several channels, we list all channels. - Target action, scenario, success criteria
We describe what the consumer wants to achieve with this interaction. We also describe how the ideal interaction scenario occurs, as well as what to do if the consumer has problems. We describe the specific criteria for the success of the scenario - we need this to collect statistics on the quality of the passage of each point of contact. - Point / channel criticality
Helps to concentrate on the most critical points. - Barriers
We list all the problems that consumers can face within a given touchpoint. - Ways to lower barriers
For each barrier, we define countermeasures that we must implement when optimizing the service. For example, as in my example of registration confirmation, we can control which emails the consumer enters and offer to correct mistakes in the spelling of the address. - Conversion and ROI optimization
We count the number of consumers who have come to a given point to the number of those who have successfully reached the next point of interaction. Ideally, if all consumers came to the next point (coefficient = 1.0). This is the main KPI of the point of interaction and the employee of the company who implements this interaction. Conversion will allow you to calculate the economic effect of reducing a particular barrier. For example, you can calculate that lowering the barrier within a certain touchpoint will increase conversions by 20%. By tracking this 20% further down the CJM chain and reaching the point where the consumer brings money, you can fairly accurately determine how much money the optimization of a given point will bring. If, at the same time, you still estimate the cost of lowering the barrier, then you have a value for the ROI (return on investment) coefficient. Given ROI, it will be fairly easy for you to prove to top managers the benefits of such optimization. - Other KPIs(for example, retention rate, contact time, etc.)
We can come up with a large number of KPIs that more fully characterize the quality of the service at a given point. - Psycho emotional condition, the degree of frustration and stress
We can obtain this data by looking at consumer complaints or by using qualitative methods research (interviews, field observations). As well as the criticality of the point of contact, this information helps to focus on the most important points of service delivery.
Important advice
When describing points of contact, use consumer vocabulary, not your professional one.
Below in the figure are examples of descriptions of points of interaction. I have charted a loyalty program for one oil company.
 Alexey Kopylov, 2013
Step # 3. We find who is responsible for what within the company
For each point and channel, we add the name of a specialist or a group of specialists, whose actions determine the success of interaction with the consumer.
Depending on the level of development of the company, this task can be very simple, or, on the contrary, very difficult. The more opaque a company is, the more difficult it is to collect this kind of data.
The situation is aggravated when employees find out that you are going to capture the KPI for the quality of their work. Some employees may begin to sabotage the process of collecting KPIs, they simply will not give you the data you need. First, you need to convince all employees that fixing the KPI will improve the quality of the service, which, in turn, will contribute to the promotion of career ladder... But as a rule, there will always be a pair of black sheep that will hinder transparency - and to overcome this resistance you will need the support of senior management.
Attention, ethical issue!
Not everyone works strictly according to work instructions. Some employees may bypass them to improve efficiency. If so, anonymize your sources of information as much as possible.
Step # 4. Optimizing the most critical points / channels
We take the most critical points interactions and lower barriers within these points.
Take the example of an oil company - barrier # 2 to step # 3:

This barrier can be reduced due to the competent presentation of information in the form of a sequence of actions (using graphics similar to comics). You just need to remember that any optimization should be checked after implementation - is it really a new version Does the contact point work better than the previous one?
Also consider whether you have been able to implement a push-and-pull approach to motivate consumers while promoting CJM?
More radical way optimization - remove unnecessary touchpoints. The figure below shows the CJM diagram before and after optimization. In the right diagram, unnecessary levels of hierarchy were removed and the chain of interaction as a whole became shorter.
 Alexey Kopylov, 2013
 Step # 5. We take control of the optimization process
We set the optimization process on a regular basis. After fixing the most critical touchpoints, we begin to consistently optimize the less critical touchpoints. At the same time, we establish a regular collection of KPIs (including conversion). All changes in the UX of services and products are constantly checked against KPIs.
Thus, we consistently improve the quality of services and earn credibility within the company. It is important to start with the most critical, so it will be easier for you to get approval and budget for the rest of the service improvements. Taking on everything right away is expensive and time-consuming, and there is a risk of focusing on non-essential problems.
CJM Creation Tools
Post-It leaflets
Use Post-It Sheets to get started on CJM, brainstorm, hypothesize, and capture preliminary results. Leaflets facilitate group work and are probably the cheapest tool and the most fast way fixing CJM.

Beautiful schemes
At an advanced stage, you can draw a sexy scheme in Adobe Photoshop or Illustrator, in which all the points of contact are served as delicious as possible. Such schemes are suitable for presentation to various top managers in order to obtain additional funding. However, these schemes are static and inconvenient for development, they lack most of the descriptive information. Do not overuse such schemes!

Excel + diagrams
I am currently working with two tools: Flying Logic to draw a chart and Excel (or Google Docs) to enter information for each point of contact. Flying Logic is quite well suited for such diagrams, as it was originally made for constructing Constraint Theory diagrams which dovetails quite well with CJM. The disadvantage of this method is that you have to constantly synchronize the chart and table in order for the information to be up-to-date.
 Alexey Kopylov, 2013
 Touchpoint Dashboard Web Service
It is the only web service I know that is specifically designed to work with CJM. You can not only capture the CJM, but also create crosstabs like importance / ease of implementation / effect or time to fix / cost to fix / effect. These cross-tabs will help you decide on how to optimize your service.
 touchpointdashboard.com
 It all looks very nice, however, the cost of the service looks like this (per month):
 touchpointdashboard.com
 - $ 175 for 1 user
- $ 625 for 5
- $ 950 for 10
In my opinion, this is still too expensive for most teams - we are waiting for a competitor to appear, I am sure that after that the cost will decrease.
Outcomes
Finally, I will briefly list the benefits of using CJM when redesigning a service:
- CJM allows you to spread knowledge about the real situation with consumers in your company.
- Helps to alert senior executives to egregious facts or potential growth opportunities.
- Helps to calculate ROI of CJM optimization.
- Contributes to the development of a strategy for the development of services and products that are included in it.
- Improves communication within the company.
- Increases the level of training of personnel (we go beyond pure UX).
- Improves the organizational culture of your company.
- Most importantly: it improves the quality of the service, which contributes to the loyalty of your consumers!
Dmitry Provotorov, co-founder of Manufactura, on how to use CJM to turn two stars of a mobile app rating into five and quadruple its revenue.
To bookmarks
Customer journey map(user journey map) is a product development methodology that is based on detailed analysis needs and behavior of the audience. The result of its application is an increase in the share of users who are satisfied with the use of the product. This material will discuss what the use of CJM can give to the product and its owner.
What the map shows
The work on the CJM methodology is aimed at clarifying the following points:
- where the audience comes into contact with the product;
- how different audience segments interact with the product;
- what stages users go through on the way to their goals and what emotions they experience;
- where they face barriers that prevent them from achieving their goals;
- how well users move from one stage to another.
To get answers to these questions, you need audience observation. If the project is just being developed, then one of the options for obtaining data is to launch an MVP (minimum viable product) with an analysis of audience behavior at every step.
This is how Pedro Marquez, product designer for the largest online hotel booking service, Booking.com, put it:
Moving in small iterations at the start gives you real confidence that you are creating something right. Making a big decision without intermediate measurements is risky. If it works, you don't know what exactly worked. If it doesn't work, you don't know what to fix.
Pedro Marquez
Product Designer Booking.com
Market view: СJM is just beginning its journey in Russia
How widely is the Russian market familiar with the CJM methodology? Manufactura asked this question to several companies with notable digital products.
Those Russian companies who use the Customer Journey Map throughout the entire creation and life of a product are rare and highly advanced UX teams. CJM is a practice that should be used when building a product from the very beginning, even at the idea stage.
Natalia Sturza
UX-analyst of the bank for entrepreneurs "Tochka"
There are few companies using CJM in Russia. Most work with the traditional approach of formal improvement. For example, a company implements an electronic queue system to automate processes and devotes all its efforts to its development, while not delving into how to make it really convenient for people who work with it every day. Nevertheless, there is a demand for transformation of business processes in the framework of CJM, and it is quite large.
Alexander Kireev
Neuroniq consultant (CJM projects for X5 Retail Group, Rigla pharmacy chain and others)
Ozon does not adhere to strict canons and rules when designing products. We select tools depending on the task, and our developers can also use the Customer Journey Map. This methodology for analyzing user behavior and identifying points for product improvement is quite effective and easy to use.
Daria Negresco
Public Relations Manager Ozon
CJM is now gaining momentum, I see it in the digital world more and more often. I brought a Customer Journey Map to Evotor from my previous place of work - from the digital company Alfa-Bank Alfa-Lab. There, this methodology is used in many products related to Internet and mobile banking. However, I will not argue that absolutely everyone needs CJM - it is better to try and evaluate it personally.
Nadezhda Avdanina
product leader at Evotor
We have been using the Customer Journey Map since the very launch of the Conscience project. CJM helps to evaluate the entire journey of the client: from the moment of his first visit to the site of the "Conscience" card to the moment he becomes an active buyer of goods in installments. We also use CJM to improve the performance of the application in which our sales agents work. So, we added elements of gamification to it - we made it possible for sales agents to compete throughout the day and challenge each other to battles. As a result, employees' interest in work and their productivity increased.
Nadezhda Onischuk
Product Development Manager of the "Conscience" installment card
CJM can be called a well-known but underutilized tool in the arsenal of product managers. At Skyeng, we use CJM for product development, where there is not only IT, but also a large operational component - communication with teachers, call center, customer care, and so on. At the same time, our CJM is dual: it displays how the paths of the student and teacher overlap. This helps to improve user interaction with both the product and the teacher.
Mikhail Karpov
Product Director of Skyeng Company
In my opinion, CJM is now poorly distributed, companies with such products can be counted on the fingers of one hand. We at Dodo Pizza are just starting to use CJM, but for quite some time and have been heavily using a related tool - User Story Map, which serves to visualize complex user scenarios and prioritize development tasks.
Anton Bevzyuk
Chief Agile Officer at Dodo Pizza
CJM is increasingly being used by large companies with complex products. Scenarios where there are more than three points of contact can be considered complex. If you have an online store with the chain "external banners - store - call center - courier", then you may think that you keep all the transitions between these points in your head. But this is illusory. And the owners of complex products were the first to understand this, but now the rest of the market is coming to this. At QIWI, we build a CJM for each new function and periodically examine the user's path through the already implemented solutions.
Alena Egorova
UX designer, customer experience manager "QIWI Wallet"
Thus, market players consider CJM to be one of the most effective, but not yet widely used tools.
Five steps to understanding
The Customer Journey Map methodology describes the general principles of product development, the application of which can vary in practice. The CJM use case we use at Manufactura includes five steps.
Step 1. Audience segmentation
The work on compiling a CJM begins with a classic marketing split target audience into interest groups.
Our client, the German infotainment portal Meinestadt, contacted us with the task of developing a mobile application. We installed triggers in it to record user actions and highlighted the most frequent scenarios in them, which made it possible to divide the target audience into three main segments.
- Party-goer. Logs into the application to search interesting events(concerts, exhibitions, sporting events) and buy tickets.
- Navigator. Uses the app to find the right places - restaurants, bars, gas stations, and so on.
- Reader. Studying the news feed to keep abreast of what is happening in the city.
It is noteworthy that the client wanted to bet on a completely different audience segment - authors who themselves generate content in the application. But the analysis showed that there are almost no such users. This saved the product owner from mistaken investment in unclaimed functionality.
For new products that do not yet have an established audience, you can use the analysis of competitive analogs, data from open sources, consultations with experts, questioning the intended audience, forecasting based on theoretical models (for example, the well-known Pareto 20/80 principle) and some other methods.
Step 2. Determination of aha moments
The aha moment is the point where the user finds what they are looking for and experiences strong positive emotions. After that, he will most likely decide to become a regular visitor.
Therefore, in the search for aha-moments of a working product, measuring the retention rate in different segments of the audience helps: where there are more returns to using the product, there, most likely, goals are achieved more often.
In the Meinestadt app, users in each of the three audience segments returned if they found what they were looking for the previous time. A concert of your favorite band, a gas station with low gas prices or an important announcement from the local police. "Found!" - that was the aha moment for them.
Step 3. Formation of user scenarios (user flow)
The next step is to figure out how the user arrives at the aha moment. For example, he sees an advertisement, installs an application, scrolls the news feed, sees an event, visits his page and - eureka! - buys tickets.
The steps are lined up in flows (user flow), after which you can measure the percentage of conversion from step to step.
To establish a sequence of user actions, help various systems analysts.
- For web products: Google analytics, Yandex.Metrica, Roistat.
- For mobile products: Localytics, AppMetrica from Yandex, Amplitude, Flurry Analytics, Fabric, CleverTap, Adjust, Branch.io.
Step 4. Creating a Customer Journey Map
User flows, consisting of steps and aha moments, are combined on a visual map that clearly shows all the main models of audience interaction with the product.
The value of this card is in high objectivity - it is based on the results of analytics of real events and does not contain unverified hypotheses.
Behavior map of the three main target audience segments of the Meinestadt mobile application
Step 5. Analysis of the audience's condition, identification of barriers
Second important document when compiling a Customer Journey Map, in addition to the user movement scheme, it is a transcript of it with a description of each step of the users and the removal of data characterizing his behavior at this step.
Knowing the size of the audience at each stage, we can calculate the conversion of the transition from step to step and detect critical points. If 80% of users go from the first step to the second, and only 5% go from the second to the third, this means that there is a barrier somewhere here.
Perhaps the user did not find the search icon, or a link appeared on his path leading away from the application. Having identified the barriers, we can eliminate them: make the desired functionality more noticeable, remove distracting elements, and bring the most popular options forward.
The result of drawing up a Customer Journey Map is a ranking of functionality according to the degree of demand and a prioritized list of tasks for finalizing the product.
What CJM gave
By mapping the user's journey for Meinestadt, we were able to develop a development strategy for the application that took into account the interests of users. However, after the launch, the audience initially responded with low ratings and outraged calls to return "everything as it was."
At the same time, users viewed more and more content and performed more and more targeted actions. The number of returns has also increased. People were indignant, but they used it because it was convenient.
After a while, the app's score went up sharply, rising from 2.0 to 4.67. The audience got used to the new interfaces, besides, we identified the most important user complaints and made a number of minor improvements on them.
The profit at the first stage after the launch of the new application grew by 138%, and after a while - four times. This growth was organic - we did not introduce any additional monetization mechanics, did not increase the number of impressions and ad integrations, we only developed a new structure and well-thought-out interfaces for the application.
Why CJM
Based on the results of this project, our client and I made several conclusions for ourselves.
1. Users who achieve their goals with the help of the product bring profit to it
One of Meinestadt's monetization models is to receive a reward from an apartment rental service for each user who switches. In the new application, where search functions are brought to the forefront, it has become much easier to search for rental housing, so there are much more clicks, and the amount of remuneration from the rental service has increased.
2. CJM allows you to use the project budget in the most rational way
The development of the in-demand functionality that was identified with the help of CJM helped to achieve the growth of the product's business performance. By investing in unverified hypotheses, the client risked spending the budget less efficiently.
You can do ten desired functions and win, or you can use 50 unnecessary ones and lose.
Thank you for the attention. Study your audience and people will reach out to you.
There is a customer journey in every business, but most entrepreneurs don't think about it. In every business on the territory of the CIS, the client's journey begins at the moment when the client gets into the zone of business activity. Or, in simple terms, went to the site or crossed the threshold of the store. Successful business people think differently.
Let's take a prime example of a company's customer journey. Starbucks ... The path begins from the moment when a person has an idea to drink coffee in the office, then he discusses with friends where he will drink coffee, then he drives, parks, enters a cafe, stands in line, and so on.
The customer journey is somewhat similar to a sales funnel, only in a more global sense of the word. The customer journey can take years. The funnel is a small part of your business, while the customer journey is a bigger challenge.
You can google good examples using the keyword “ Customer journey map ".
Let's take a look at how to analyze the customer journey in your business. I will describe the customer journey for an online children's clothing / footwear store. In this example, we will not elaborate on the details, now it is important to understand the essence of this approach.
Defining the main stages of the customer journey (customer journey)
The first thing to do is break down your customers' journey into starting points. The more points there are, the better. Their minimum should be 5-10.
- The client sees some product from other children, on the Internet in pictures or in some other place. At this moment there is a need and desire to learn about this product
- Starts asking friends about this product or googling examples
- He forgets about this product
- Again, somewhere he sees a product and begins to want it
- Looking for where to buy
- Goes to the site
- Finds a product card
- Looks characteristics
- Compares with competitors
- Leaves a request
- Manager call
- Payment
- Delivery of goods
- Consumption of goods
- Tell your friends about the product and your store
- Repeat purchase
There can be even more of these points. I described the first ones that came to mind.
Determining what the client feels and does at these stages
After we have identified the main stages of the customer journey, we need to understand how the client perceives these stages: what he feels, what he sees, what he hears, what is good, what is bad, and how it can be improved.
Stage 1. The client sees some product from other children
What does it feel: joy and interest. Receives visual pleasure and desire to own these goods.
What he sees: goods on someone else's child.
What's wrong: Oclothes, on the child may be dirty and not attract attention to others potential buyers... A prospective client may not pay attention to a new product on someone else's child.
How can you improve: NScome up with a reason why a mother of a child who has a product would say to another mother:"And we have a new thing, how do you like it?" (if you come up with just this step, then the money will already be twice as much).
Stage 2. Begins to ask friends about this product or google examples
What does it feel: interest and sometimes search fatigue. Disappointment that he cannot find it right away.
What he sees: many other suggestions.
What's wrong: it is not clear where and what to look for. You can get to competitors. There are many similar proposals. I was looking for one, bought another.
How can you improve: NSto figure out how to avoid searching on Google and provide direct visits to the online store from the phone immediately after receiving information on the playground.
Stage 3. The client forgets about this product
What does it feel: distracted by something else. There can be different feelings.
What he sees: other offers from different fields.
What's wrong: forgot about the product, and there is a chance that he will not remember.
How can you improve: figure out how a girlfriend with another child can anchor a potential client. It's corny to say that the promotion ends tomorrow.Figure out how you can take contacts from a client when you first visit the site.
Stage 4. Again, he sees the product somewhere
What does it feel: feels the need for a product. He understands how good he is and begins to want him.
What he sees: product advantage.
What's wrong: there is no way to immediately remember the site where she could buy this product. We have to look again. Can get to competitors.
How can you improve: send an email with a reminder about the product. The client should immediately remember that he can buy this product on your website and he does not need to look for an alternative on the Internet.
Stage 5. Looking for where to buy
What does it feel: the excitement of a future purchase is in a state of expectation of pleasure. May feel angry after a long search, lack of information, annoyance at uncomfortable competitor sites, etc.
What's wrong: goes to competitors.
How can you improve: remind about yourself by email, create a user-friendly website and product descriptions, where everything is clear at once.
Stage 7. Finds a product card
What does it feel: anger from a long search for a product. The price, the availability of the goods, there are no available characteristics of the goods, etc.
What he sees: small photos. Few photos. Incomprehensible interface.
What's wrong: can not understand anything. Inconvenient site interface, many categories and unnecessary products.
How can you improve: send relevant email messages, bypassing the entire structure of the site. Improve website usability and design. Increase the website loading speed, introduce additional navigation widgets that will show what the person looked at the last time and will push them to buy.
Stage 8. Looks characteristics
What does it feel: misunderstanding of the product and the desire to compare with another product. Thinks about price and value. Doubts to buy.
What he sees: few characteristics of the product, does not understand whether it is in stock.
What's wrong: there is no video review and detailed description. High price. He does not fully understand why he needs it.
How can you improve: put reviews, make a video review, if a person has visited the page several times, make a pop-up window with a discount. Improve the usability of the product card.
Stage 9. Compares with competitors
What does it feel: opportunity, find cheaper.
What he sees: other sites.
What's wrong: can buy from competitors.
How can you improve: send a trigger mailing, set up a retarget. Anchor attention. Make it so that he does not leave to look at other sites.
Stage 10. Returns to your site
What does it feel: that here he has already looked and found nothing
What he sees: your site through the lens of other sites it has visited. Is your site good or bad compared to others?
What is wrong: the site may turn out to be worse than that of competitors.
How can you improve: work out usability. Make a pop-up window "You have returned to us".
Stage 11. Submits a request
What does it feel: expectation and need for a product, interest.
What he sees: your site or other products, or goes to competitors.
What is wrong: waiting.
How can you improve: improve the speed of response to the application, take the user's attention while the manager is calling. After the application, substitute useful content related to the product, and not lose the user's attention until the manager calls.Make payment possible without a manager.
Stage 12. Calling the manager
What does it feel: liking or disliking a person's voice and accent. Subconscious analysis of speech literacy.
What he sees: better to look at the product being discussed.
What is wrong: no physical contact. The user needs to talk to the manager. The competence of the manager, the speed of response to the request.
How can you improve: implement an auto funnel and sell without managers. Register scripts for managers. Do good content marketing so that the user gets answers through video reviews and articles, and not from the manager.
Stage 13. Payment
What does it feel: anxiety and doubt.
What he sees: clear or incomprehensible interface of payment systems. Nice or ugly design. Feels like he might be tricked. Needs support.
What's wrong: may get distracted and not complete the payment process.
How to improve: remove card details by selling tripwire, and thereby build confidence before selling the main product. Make a convenient payment in several ways. Make a video instruction on payment. Add reviews to the payment page.
Stage 14. Delivery of goods
What does it feel: waiting and anger if delivery is delayed.
What he sees: the focus of attention is lost.
What's wrong: the focus of attention is lost.
How to improve: improve logistics, make content on the use of goods during the delivery period in order to keep the focus of attention.
Stage 15. Consumption of goods
What does it feel: joy
What he sees: the product itself (here you can think of packaging, etc. A good example is the MacBook: I haven't had time to use it yet, but the packaging already gives emotions).
What is wrong: it all depends on the product. It is impossible to see the moment when the product is consumed.
How can you improve: constantly improve the product itself. Make instructions for the effective use of the product.
Stage 16. Telling friends about the product and your store (the success of the business will depend on this stage)
What does it feel: joy or anger.
What he sees: other potential users of the product.
What is wrong: can talk about the cons of the product and discourage others from buying.
How to improve: come up with ready-made stories, tell them through content marketing and make people retell ready-made stories to others.
Stage 17. Re-purchase (key stage)
What does it feel: trust and brand loyalty.
What he sees: re-visits the site.
What is wrong: may not buy again.
How to improve: implement an auto funnel and marketing automation to constantly stimulate sales. Create a chain of letters after the sale of the product. Make separate chains with upselling of other products.
Using this example, I did not go deep into the essence of the processes, but only showed the methodology of how to do it. If you get the point, you will notice that at certain stages of the path you will have serious holes. If you take our company TimeDigitalCRM, then a serious hole in the client's path is the installation of the code on the site. A lot of people merge on this, and we have to explain how to do it and find contractors who can help our clients cope with this, at first glance, elementary task.
In this article, you learned the basis of the customer journey development approach. In the next article, I'll be covering specific techniques that will improve the different stages of the customer journey.
If you are interested in this topic, then sign up for ours, which take place every Tuesday and Thursday. On them, we talk in more detail about the topic of marketing automation. And of course, share your comments and tell us where your client's customer journey begins.
When developing a mobile application or web service, the product owner strives to make people like it and become an indispensable tool for them. Unfortunately, this is more difficult than it sounds. Actual design interfaces, functionality, performance - this is not all that is needed, and, leaving out the little things, good, promising ideas fail.
What do you need to focus on?
To be liked by people, an application must meet their needs and solve their problems. It is impossible to come up with needs for your users - you need to know exactly what worries them. If we are talking about a finished product, then you need to know what they do not like and what in your product is a barrier, an obstacle in solving user problems. One way to find out is to apply the Customer Journey Map (CJM) methodology.
The manufactory is engaged in the development of digital products - mobile applications and web services. This article is about creating a Customer Journey Map Special attention is given to this particular industry. At the same time, the methodology itself has a wider application - you will see this in the examples of such companies as Lego, Starbucks or Lancome.
Part 1. Theory. What is Customer Journey Map?
Customer Journey Map is a methodology that helps to understand the path that a user takes when interacting with your product: what he likes, what annoys him and what can help him. Thanks to CJM, you can come up with new ideas for product development and dramatically improve user satisfaction. In the case of a new product launch, using this methodology, you will be able to foresee problem areas and “spread straws” in advance so as not to make mistakes.
In a narrower sense, Customer Journey Map is visualization of consumer interaction with a product (application, web service, brand). It is a map on which points of contact, barriers and emotions arising in people are drawn.
A simple example of cuStomer journey map of buying a cell phone
Let's imagine a situation.
- Awareness. A man needs a new smartphone. The old one is broken.
- Study. He goes online and starts looking for a suitable model. He knows the brand that he likes, so he reads about its new products, examines the closest competitors and reads reviews. Then he examines offers from different retailers and compares prices.
- Purchase... After researching, he finally buys a phone.
- Usage... The customer inserts a SIM card and starts using the device. Over time, a problem arises - the connection to wi-fi disappears.
- Support... With this question, a person turns to support. Perhaps he writes about his problem on social media with a mention of the brand to speed up the receipt of feedback.
- Word of mouth. If the user is ultimately satisfied with his "journey" - he tells his friends about the brand and the product, recommends it. If not, then it discourages you from buying.
All these actions - from realizing the need to interacting with the brand after the purchase - this is the customer journey. And the visualization of this path is a user journey map, a Customer Journey Map.
CJM for the same process can look different - in the form of tables or diagrams that serve the same purpose - describing user motivations, goals, feelings and actions at each stage of the interaction.
What can you learn with the Customer Journey Map?
The CJM methodology allows you to find out the following points:
- how different audience segments work with the product;
- where (web interface, mobile app, email, push notification, office, brochure) does the audience interact with the product;
- what steps the user takes on the way to his goal;
- how they feel at every step;
- where aha moments arise - points of the highest satisfaction with the product;
- where people face barriers that prevent them from achieving their goals;
- how well users move from one stage to another.
It is very important here that the Customer Journey Map is the foundation for generating new ideas that will make the experience of people interacting with your product better.
Who can the Customer Journey Map help?
CJM can be used by different types of companies - both those whose digital product generates additional revenue, and app-based companies for which the digital product is the backbone of their business.
Also this methodology can help on different stages product existence:
1. Start of the project
You have decided to create a new product. There is a strong idea, but the level of uncertainty is very high, and you fear a low return on investment. You want to envisage possible problems and reduce risks.
2. Something went wrong with an existing product
The churn of users from the application is growing, overtaking the influx of new users. You don't know what is the reason and you have no idea how to fix it. The product gets a lot negative reviews from the audience, but you are not sure if the “screaming minority” is drawing your attention to real issues.
3. The successful product stopped developing
The product has exhausted itself and reached " glass ceiling”, And now we need an idea that will strengthen the connection with the old audience, attract new users and show the way for further development.
Where can I get data for building a Customer Journey Map?
| Existing product | Designed product |
| Connecting analytical systems to the product. For mobile products: Appmetrika, Localytics, Amplitude, Firebase, Flurry, Fabric, CleverTap, Adjust, Branch.io and others. For web products: Google Analytics, Yandex.Metrica, Roistat. |
|
Another important option for obtaining data in the case of a new product is the launch of a minimum viable product (MVP). It may be enough for an MVP to take 20% of the planned functionality and invest up to 60% of the budget in its launch.
Parsing the Lancome PARIS example
Here's what the Lancome customer engagement map looks like:
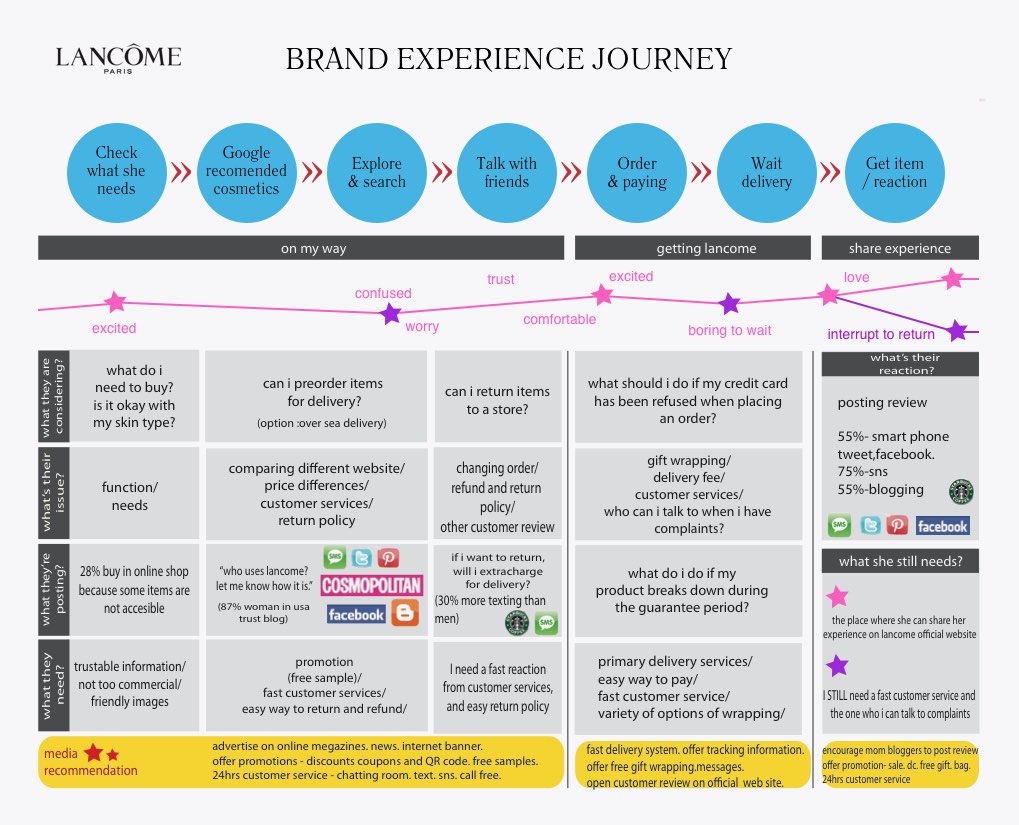
The blue circles show the sequence of actions: realizing a need, reading recommendations, researching an offer, discussing with friends, ordering and paying, waiting for delivery, receiving goods and evaluating them.

The pink line with multicolored stars describes the emotional state of the buyer: at the moment of realizing the need - uplifted, at the stage of searching - anxious, after discussion with friends - partially satisfied.

The columns below describe what issues are of concern to the buyer at each stage and what could satisfy him as much as possible at this moment. For example, at the stage of realizing the needs of Lancome customers ask the question: "What product should I buy for my skin type?" and need reliable information on this topic.
At the stage of choosing funds, they are interested not only in prices, but also in terms of delivery, study information about the brand, need free samples of products, fast customer service and the ability to return the product without any problems.
In this case, the product is the entire brand, and the map describes all stages of the customer's interaction with it, including non-digital ones. To create it, it took a number of studies - interviewing buyers, referring to statistics, etc.
If the product is a mobile application, then the measurement methods will be no less complex, and the process itself will require serious preparation.
Examples of Starbucks, Lego, MERCEDES BENZ, IKEA and other companies
Other examples that you can find on the Internet:


Part 2. Practice. How to walk the user's path with him?
The Manufactura company identifies 5 steps that help to map the user's journey through the product.
We will demonstrate the application of the Customer Journey Map using the example of the development of the Meinestadt mobile application for a German company.
Briefly about the project
- Customer: hyperlocal media Meinestadt, containing information about events, objects, acquaintances, rental real estate in German cities. The mobile app has been installed 1 million times.
- Task: achieve KPIs for user satisfaction and revenue growth.
- Development term: 12 months.
- Process: MVP and 6 updates released in 12 months. In the 9th month, the app's revenues equaled the development costs.
- What have you achieved with CJM?: The app's revenue turned out to be 138% higher than the planned KPI set at the start of the project. Average monthly app score in the App Store and Google play rose from 2 stars to 4.67.


Step 1. Audience segmentation
Even the most basic mobile apps cannot have a completely homogeneous audience. Therefore, as part of the first step, we propose to use a classic marketing technique - segmentation.
We set up triggers in the application that capture the sequence of actions of people, and then determine which scenarios are repeated most often. This helped distinguish three main groups:
- Reader... Examines the feed in search of interesting news. This role is taken on by 69% of the audience.
- Navigator... Looking for objects - restaurants, cafes, bars, gas stations. 58% of the audience.
- Party-goer... Searches for interesting events through the application - concerts, sporting events, exhibitions, and buys tickets for them. 50% of the audience.
This list did not include Authors - a segment of the audience that our client initially believed in. Analytics showed that users who would like to generate content themselves (write notes, upload photos) are only 0.01% of the audience, which is very few. ☝️ Refutation of the erroneous hypothesis saved the client from investing in unclaimed functionality.

Step 2. Search for aha moments
When the user finds what he wants, he says "aha, this is it!" and has a strong positive emotion... This is the aha-moment, the point of satisfaction of the need, to which a person will return again and again.

Overlay multiple graphs
Retention from Yandex.Appmetrika
The Retention rate indicator is an important guideline in the search for aha moments. When we surveyed Meinestadt's audience, we saw that people who used search to find a place of interest returned to the app more often than those who simply searched the list of suggested places. This is how the idea was born to make the search more accessible and understandable.
We compare the Retention rate of users performing different actions and look for an a-ha moment for each audience segment. Here's what we found:
- Reader immediately after a-ha moment - shares the news on social networks;
- Navigator- plots a route.
- Party-goer- adds to the calendar, buys a ticket.
The definition of aha moments helped to establish itself in the selected audience segments and understand what functionality is most in demand.

Step 3. User Flow - defining custom flows
At this stage, we already know about the existence of the main audience segments and their aha moments, and now we can try to establish exactly how users go to these moments.
The main tool here are analytics systems that allow you to determine the order of user actions in the application - Localytics, Appmetrika, Fabric and many others.
Let's say a person opens the Meinestadt application, from the feed goes to the "Events" section, selects the category of interest, goes inside the event card and plots a route to this place or shares it with friends. Eureka! He found what he was looking for, and now he knows how to get there.
This is how the visualization of key user flows for each audience segment of the Meinestadt application looks like:


Step 4. Designing the Customer Journey Map
It's time to combine the collected data into one map, which may look like a table that contains:
- a list of steps that the user takes;
- success criteria - what counts as reaching a user step;
- retention rate, i.e. the rate of returns, subject to the achievement of a specific step;
- conversion when moving from one step to another;
- point of contact - mobile app, website, email, push notification;
- audience size at every step;
- description of the emotional state (“I seem to be confused”, “Isn't it possible to give up everything?”, “I'm close to the goal”, “What you need!”, also the emotional state can be described using emoji);
- the degree of criticality of the point;
- barriers;
- ways to lower barriers to different points of contact - these are your ideas for development.
About barriers and how to deal with them
If the percentage of transition from one stage to another is low, this may indicate that there is a barrier in the user's path. Perhaps he did not find the icon he needed, met with an authorization requirement for an insignificant action, met an external link and followed it.
In the Meinestadt application, before the creation of a user journey map, the first place was the functionality for UGC (user generated content, user generated content). But the bulk of users did not want to create anything - they were interested in search. Therefore, we removed the UGC functionality (the "Write news" button) from a prominent place and brought the search bar to the first screen.
In another project for the development of Pikabu, as part of the fight against barriers, we allowed users to take part of the actions without registering, and also, for example, showed the hottest comment of the discussion to make it easier to access interesting discussion.

Step 5. Ranking ideas and determining the MVP
The ways to lower the barriers found in the previous step are a developer's guide to action. Now he knows what needs to be finalized in the near future.
But the list of barriers and methods for their elimination can be very long, so it is very important to prioritize them in order to implement the most demanded functions in the first place.
Priority can also be determined not "by eye", but using certain methods. The Manufactura team, when working with the Customer Journey Map, uses a formula for calculations, where the following indicators are added: the degree of criticality of the point, the ease of design implementation, the ease of implementation of the development and the percentage of the audience affected.
As a result, we get a ready-made feature list, ranked by priority. The highest positions in it are occupied by tasks that, on the one hand, have the maximum impact on the audience and at the same time take away a minimum of resources.
It's also extremely useful to easily determine what functionality your MVP needs if you haven't started development yet.
CJM efficiency: stars and money
The German audience is quite conservative, so when we launched the updated Meinestadt application, at first, users gave low ratings and demanded in the comments “to return everything as it was”. However, retention, the rate of return to an app, started to rise. People loved the app! Following retention, grades began to grow.
During the year during which we were developing and making releases every 1-2 months, the average monthly rating of the application increased from 2 to 4.67 stars. Revenue increased 138% from the expected level.
CONCLUSIONS
User satisfaction is the best way to make money... One of the monetization models of the Meinestadt app is associated with the transition of users to the rental service. Noticing that the section with the search for real estate is popular, but there is little targeted action, we identified barriers and eliminated them during a complete redesign of the interfaces. This increased the average monthly app rating from 2 to 3.75 stars and increased the number of transitions to the rental service. After a while, we added geolocation push notifications about rental apartments to the application, which increased the profitability of one user by 3 times, and the product rating in mobile app stores to 4.67 stars. You make the user's life easier and more convenient, and this is reflected in your benefit.
Alexey Kopylov, UX expert at Kaspersky Lab, co-founder of UIDG, author of the Customer Journey Map design training course, wrote an interesting guide to working with the Customer Journey Map. With his permission, we present a version of this article at.
Introduction
When I am asked to design a user interface for a website, I immediately ask if I need to design an interface for mobile devices as well, and, as a rule, I get an affirmative answer. The fact is that modern sites and programs that can be called digital products are, as a rule, part of a large service. And the further, the more digital products (websites, applications) will be involved in the interaction with the user.
Let me give you an example of a rather popular service - listening to music. I listen to music on a personal computer running OS X, on a smartphone (iOS), and on an Apple TV. Apple has thought through the process of consuming music quite well: I can buy an album on my iPhone, and then I can listen to this album on Apple TV, to which I have large speakers connected. However, I cannot start listening to a certain song on my iPhone, and then continue listening to it on Apple TV - for this I have to search for the desired album in the Apple TV menu, this procedure cannot be called simple. That is, at Apple, no one bothered with such an opportunity and did not implement it. That being said, both the iPhone designer and the Apple TV did a good job. The functionality that I need is on the border of two devices and it is not clear who should be responsible for designing such bundles.
This example shows that in our time it is not enough to think through the details of the user interface of one digital product in isolation from interaction with other products with which they are in a single infrastructure. You need a tool that allows you to identify problems at the seams, and also allows you to design connections between products. As usual, the need provoked the creation of a wonderful new methodology called "Customer Journey Map".
Customer Journey Map is arguably the best User Experience tool in the last 10 years (after characters).
What is a service?
What is a service? For lovers of strict definitions, I will quote from GOST-9000-2008:
A service is the result of at least one action that is necessarily carried out in the interaction of a supplier and a consumer, and, as a rule, is intangible.
Let's remember the word "result" - this is what is most important to any consumer.
As I reported, today's consumers interact with mobile devices, web browsers, people, environments and spaces, and so on. Each act of consumer interaction with a service is called a “point of contact”.
Contact points can be not only digital, but also analog or offline.
Take a modern bank, for example. What points of contact can we highlight here?
- bank website;
- web service "client-bank", where the user can carry out transactions with his account and bank cards;
- mobile application "client-bank";
- a physical branch of a bank that can also be considered a product. Just like with websites, there is a navigation system inside the bank branch.
Suppose you came to the bank for some purpose and are not yet very familiar with the rules of its operation. If the navigation was poorly designed, then you may not understand exactly who to contact to solve your problem. You have to contact the girl at the reception, to whom there may be a separate line of customers.
With this example, I wanted to illustrate the simple idea that bank branches can and should be designed similarly to websites.
What is Customer Journey Map?
So what is a Customer Journey Map (for short, just CJM)?
CJM is a directed graph, on which the path of the consumer of the provided service is displayed with the help of points of contact. The CJM records the details of the interaction with the service.
That is, CJM displays exactly how the consumer interacts with the service - which points of interaction exist, through which channels the interaction is carried out (web, mobile application, offline point of presence, etc.), as well as what happens inside each point of contact.
Here are examples of typical CJMs (just pay attention to the outside of the diagram for now):


Let's take a look at a simplified CJM example:

You see three representatives, each representing a different consumer group. In the process of consuming a service (achieving a goal), they have to interact with different products. At each point, an act of service takes place with a certain level of quality:

The overall experience of a service usually depends on the quality of service at all points of contact. The principle of the weakest link is at work - one unsuccessful interaction casts a shadow on the entire service. Therefore, it is very important that each touchpoint is worked out with maximum quality.
However, it so happens that all the points of interaction are implemented just fine, and the problems are hidden at the boundaries of the transition from one point to another. That is, it may turn out that all employees of the company serve customers well, but some consumers still do not reach their goal:

Let's illustrate this with a simple example: many online stores require you to go through the registration procedure and, often, there is such a step as confirmation of registration by clicking on a special link that comes to your mailbox (this is necessary to prove that a real person is registered, and not a robot ). In this case, the probability increases that the user will not be able to go through this step: perhaps the letter with the link got into spam, perhaps the user made a mistake and entered gmail.ru or another non-existent address instead of gmail.com, perhaps he completely forgot that he had to confirm the registration. In the examples known to me, the loss of users at this step reached 70%!
How can we lower these barriers? For example, you can control what exactly the user enters as an email and offer to correct obviously erroneous addresses. Further, if the user has not clicked within a few days on the link from the email message, then you can re-send him an email with the link. But the best thing, of course, is to abandon this step altogether - to use other methods of protection against robots!
In general, you should always implement the system so that any point of contact motivates the consumer to go to the next step (the “push” principle), and the next point pulls the consumer from the previous point of contact (the “pull” operation). The push-and-pull approach promotes a smoother customer experience with a service.
Consider the example of listening to music. In fact, Apple has a way to go from listening on an iPhone to listening on an Apple TV, which is AirPlay. However, not all consumers are aware of magic technology and therefore cannot use it. There is a rule that the functionality that users cannot find for them, as it were, does not exist. It would be possible to implement the "push-push" principle in this way: as soon as the user is in the area where the Apple TV is available, he immediately receives a message (not interrupting listening) that he can turn on the audio system (connected to the Apple TV) and continue listening already on her. Conversely, as soon as the user turns on the TV, he sees a message about which song is playing on the iPhone and what needs to be done to redirect the sound to the audio system (by pressing one button).
So, CJM allows you to control the design process of services that are implemented using various interactive products, as well as to visually visualize the process of service execution itself.
CJM Tasks
I will list all the tasks that CJM solves:
- Creation of continuous UX throughout the entire service consumption.
Remember the aforementioned push and pull. - Increase in consumer conversion.
By reducing barriers, as well as by reducing losses during the transition from the point of contact to the point of contact, more consumers reach the goal. - Increased customer loyalty.
Retention rate - the number of returning consumers grows if we have designed and implemented a service without barriers. - Increasing the responsibility of the company's specialists.
Each point of interaction has its own responsible employees from the side of the company. After we have mapped all the touchpoints, all employees in the company can see who is responsible for what and how they are doing their job (if we set up KPIs for each touchpoint). This in itself increases the level of responsibility. - Accelerate the development of multichannel services and products and improve the quality of development.
Due to the fact that all parties involved in the development more fully see how the service is being carried out, and also see all the potential weaknesses of the service and can intervene in their development in time. - Create exciting new interactions.
There is an opportunity to come up with and implement new innovative features (remember the example of continuing to listen to an audio recording when switching from one device to another).
Everything looks great, but how to create CJM?
How to create a CJM, step by step instructions
Step # 1. We identify all points of contact and channels of interaction
We draw on a map all the points of interaction of a certain typical consumer with a service. We do not forget anything! It may turn out that there are hidden touchpoints that you did not know about. For example, you might find out that some of the problems consumers solve in an informal way - using social networks (which is often the case). That is, one of the company's employees communicates with the consumer directly within the social network and helps him achieve his goal. It is necessary to record everything, including such points of interaction!
In order not to miss anything, use the mystery shopping method, that is, go through all the steps of a typical consumer of the service yourself. You can also find an outside company that will professionally identify all touchpoints with a large number of respondents.
Remember, one CJM diagram is drawn for one target group (or for one character if you are using the character technique)!
Further, it is important for each point to determine all possible channels of interaction. That is, to determine with the help of which devices interactions are carried out, for example, it can be web browsers, mobile applications, phone calls, skype calls, email, social networks. Don't forget about offline channels - visiting offices, meeting with couriers, meeting with agents, and so on. Again, unexpected channels may open up for you, for example, you may find out that a huge number of consumers come from mobile devices. And it may turn out that your site design does not take this communication channel into account.
Graphically, CJM can have a different look - a diagram can be linear if the nature of interaction with consumers is also linear:

It can be branched if consumers have multiple alternative interaction scenarios:

May have a temporary view - suitable for displaying interaction with the service during the day:

We can make several CJM diagrams for different consumer groups and for different purposes.
Step # 2. Describing contact points
Now each point of contact and each channel needs to be described.
Here is some typical information we need to capture:
- Interaction channel
Points can have several channels, we list all channels. - Target action, scenario, success criteria
We describe what the consumer wants to achieve with this interaction. We also describe how the ideal interaction scenario occurs, as well as what to do if the consumer has problems. We describe the specific criteria for the success of the scenario - we need this to collect statistics on the quality of the passage of each point of contact. - Point / channel criticality
Helps to concentrate on the most critical points. - Barriers
We list all the problems that consumers can face within a given touchpoint. - Ways to lower barriers
For each barrier, we define countermeasures that we must implement when optimizing the service. For example, as in my example of registration confirmation, we can control which emails the consumer enters and offer to correct mistakes in the spelling of the address. - Conversion and ROI optimization
We count the number of consumers who have come to a given point to the number of those who have successfully reached the next point of interaction. Ideally, if all consumers came to the next point (coefficient = 1.0). This is the main KPI of the point of interaction and the employee of the company who implements this interaction. Conversion will allow you to calculate the economic effect of reducing a particular barrier. For example, you can calculate that lowering the barrier within a certain touchpoint will increase conversions by 20%. By tracking this 20% further down the CJM chain and reaching the point where the consumer brings money, you can fairly accurately determine how much money the optimization of a given point will bring. If, at the same time, you still estimate the cost of lowering the barrier, then you have a value for the ROI (return on investment) coefficient. Given ROI, it will be fairly easy for you to prove to top managers the benefits of such optimization. - Other KPIs (for example, retention rate, contact time, etc.)
We can come up with a large number of KPIs that more fully characterize the quality of the service at a given point. - Psycho-emotional state, the degree of frustration and stress
We can obtain this data by looking at consumer complaints or using qualitative research methods (interviews, field observations). As well as the criticality of the point of contact, this information helps to focus on the most important points of service delivery.
Important advice
When describing points of contact, use consumer vocabulary, not your professional one.
Below in the figure are examples of descriptions of points of interaction. I have charted a loyalty program for one oil company.

Step # 3. We find who is responsible for what within the company
For each point and channel, we add the name of a specialist or a group of specialists, whose actions determine the success of interaction with the consumer.
Depending on the level of development of the company, this task can be very simple, or, on the contrary, very difficult. The more opaque a company is, the more difficult it is to collect this kind of data.
The situation is aggravated when employees find out that you are going to capture the KPI for the quality of their work. Some employees may begin to sabotage the process of collecting KPIs, they simply will not give you the data you need. First, it is necessary to convince all employees that fixing the KPI will improve the quality of the service, which, in turn, will contribute to moving up the career ladder. But as a rule, there will always be a pair of black sheep that will hinder transparency - and to overcome this resistance you will need the support of senior management.
Attention, ethical issue!
Not everyone works strictly according to work instructions. Some employees may bypass them to improve efficiency. If so, anonymize your sources of information as much as possible.
Step # 4. Optimizing the most critical points / channels
We take the most critical points of interaction and lower the barriers inside these points.
Take the example of an oil company - barrier # 2 to step # 3:

This barrier can be reduced due to the competent presentation of information in the form of a sequence of actions (using graphics similar to comics). Just keep in mind that any optimization needs to be tested after implementation - is the new version of the point of contact really performing better than the previous one?
Also consider whether you have been able to implement a push-and-pull approach to motivate consumers while promoting CJM?
A more radical way to optimize is to remove unnecessary touchpoints. The figure below shows the CJM diagram before and after optimization. In the right diagram, unnecessary levels of hierarchy were removed and the chain of interaction as a whole became shorter.

Step # 5. We take control of the optimization process
We make the optimization process regular. After fixing the most critical touchpoints, we begin to consistently optimize the less critical touchpoints. At the same time, we establish a regular collection of KPIs (including conversion). All changes in the UX of services and products are constantly checked against KPIs.
Thus, we consistently improve the quality of services and earn credibility within the company. It is important to start with the most critical, so it will be easier for you to get approval and budget for the rest of the service improvements. Taking on everything right away is expensive and time-consuming, and there is a risk of focusing on non-essential problems.
CJM Creation Tools
Post-It leaflets
Use Post-It Sheets to get started on CJM, brainstorm, hypothesize, and capture preliminary results. Leaflets facilitate group work and are probably the cheapest tool and fastest way to fix CJM.

Beautiful schemes
At an advanced stage, you can draw a sexy scheme in Adobe Photoshop or Illustrator, in which all the points of contact are served as delicious as possible. Such schemes are suitable for presentation to various top managers in order to obtain additional funding. However, these schemes are static and inconvenient for development, they lack most of the descriptive information. Do not overuse such schemes!

Excel + diagrams
I am currently working with two tools: Flying Logic to draw a chart and Excel (or Google Docs) to enter information for each point of contact. Flying Logic is quite well suited for such diagrams, as it was originally made for constructing Constraint Theory diagrams which dovetails quite well with CJM. The disadvantage of this method is that you have to constantly synchronize the chart and table in order for the information to be up-to-date.

Touchpoint Dashboard Web Service
It is the only web service I know that is specifically designed to work with CJM. You can not only capture the CJM, but also create crosstabs like importance / ease of implementation / effect or time to fix / cost to fix / effect. These cross-tabs will help you decide on how to optimize your service.

It all looks very nice, however, the cost of the service looks like this (per month):

- $ 175 for 1 user
- $ 625 for 5
- $ 950 for 10
In my opinion, this is still too expensive for most teams - we are waiting for a competitor to appear, I am sure that after that the cost will decrease.
Outcomes
Finally, I will briefly list the benefits of using CJM when redesigning a service:
- CJM allows you to spread knowledge about the real situation with consumers in your company.
- Helps to alert senior executives to egregious facts or potential growth opportunities.
- Helps to calculate ROI of CJM optimization.
- Contributes to the development of a strategy for the development of services and products that are included in it.
- Improves communication within the company.
- Increases the level of training of personnel (we go beyond pure UX).
- Improves the organizational culture of your company.
- Most importantly: it improves the quality of the service, which contributes to the loyalty of your consumers!
Afterword: what to read?
On the Internet you will find many articles on keywords of this article.
There are also a couple of books on this topic:
This is Service Design Thinking
An excellent fresh book, completely relevant - I highly recommend it!